Safe Haven Stocks with Strong Sales and EPS Growth Over the Last 3 Years
Resilient Picks Delivering Consistent Growth Amid Market Volatility
Over the past three years, the relationship between sales growth, EPS growth, and stock price movement has been a key area of focus for investors seeking to understand a company's financial health and market performance. While strong sales growth and EPS growth often signal a company's ability to generate revenue and profitability, the corresponding stock price performance doesn't always align with these fundamentals. This article explores the dynamics between these metrics, analyzing how sales and earnings growth have impacted stock price movements, and uncovering the factors that can lead to discrepancies between a company's financial performance and its market valuation.
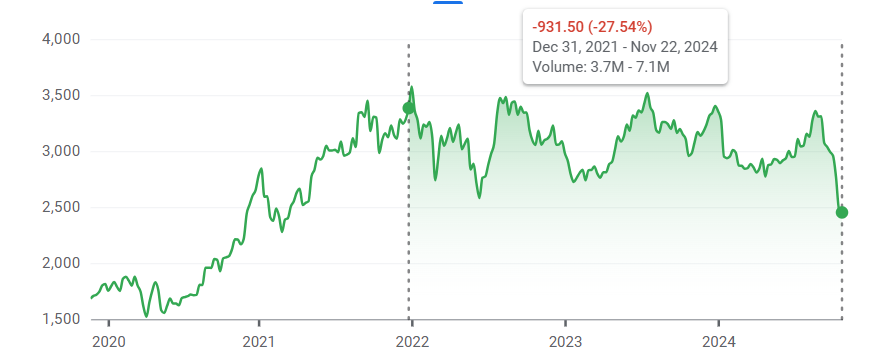
Asian Paints - CMP Rs 2,450
|
Asian Paints
|
2022
|
2023
|
2024
|
CAGR
|
|
Sales (Rs Cr)
|
29,101
|
34,489
|
35,495
|
10.44 per cent
|
|
EPS (Rs)
|
31.59
|
42.81
|
56.92
|
34.23 per cent
|
Sales CAGR of 10.44 per cent indicates stable revenue growth, while EPS CAGR of 34.23 per cent, far outpacing sales, highlights a significant improvement in margins driven by cost optimization and enhanced operational efficiencies.

The -28 per cent stock price return despite robust EPS growth indicates that the decline is likely driven by external market pressures rather than company-specific issues.
The mismatch between EPS growth and stock price performance could signal an opportunity if the decline is largely due to new entrant Birla Opus into the paint industry, but the fundamentals remain strong.
Asian Paints has historically traded at high P/E multiples at 99 in Jan 2022, but currently stock is trading at P/E 49 which is also quite below its median P/E of 76.4.
The current EPS of Asian Paints is Rs 47.6, and with a P/E ratio of 49, the intrinsic price of the stock is calculated at Rs 2,332. While the stock is currently trading at Rs 2,447, slightly above this intrinsic value, it is still below its intrinsic value when compared to its historical median P/E, suggesting potential undervaluation based on past trends.
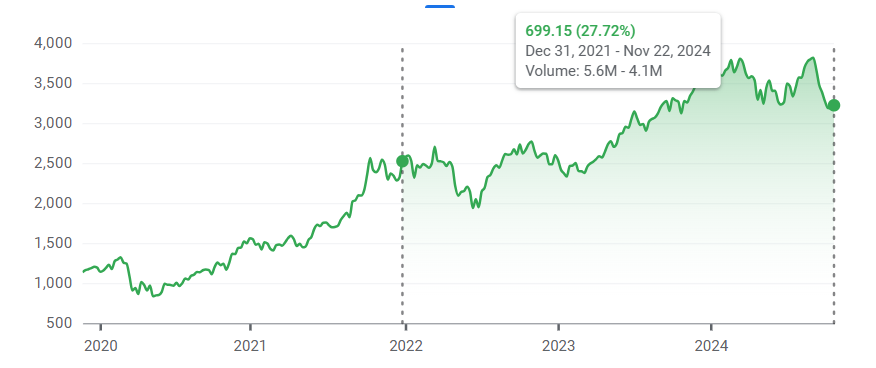
Titan Company - CMP Rs 3,225
|
Titan
|
2022
|
2023
|
2024
|
CAGR
|
|
Sales (Rs Cr)
|
28,799
|
40,575
|
51,084
|
33.18 per cent
|
|
EPS (Rs)
|
24.48
|
36.61
|
39.38
|
26.83 per cent
|
The impressive CAGR of 33.18 per cent for sales and 26.83 per cent for profits indicates a robust growth trajectory for Titan. This growth is likely driven by factors such as increasing consumer spending.

Stock prices can grow similar to EPS due to changes in the P/E ratio. Ideally, stock price growth aligns with EPS growth, supported by consistent sales growth.
Titan's current P/E of 87, below the historical median of 123, suggests the stock is reasonably valued. However, the stock's return over the last three years has mirrored its EPS growth, indicating that price appreciation has largely reflected earnings growth. Future returns may depend on continued earnings improvements
The intrinsic value of Titan's stock, based on an EPS of Rs 41 and a current P/E of 88, is Rs 3,608. With the current share price at Rs 3,664, the stock is trading slightly above its intrinsic value. However, it remains undervalued when compared to its historical median P/E of 123, suggesting potential upside if the stock reverts closer to its historical valuation levels.
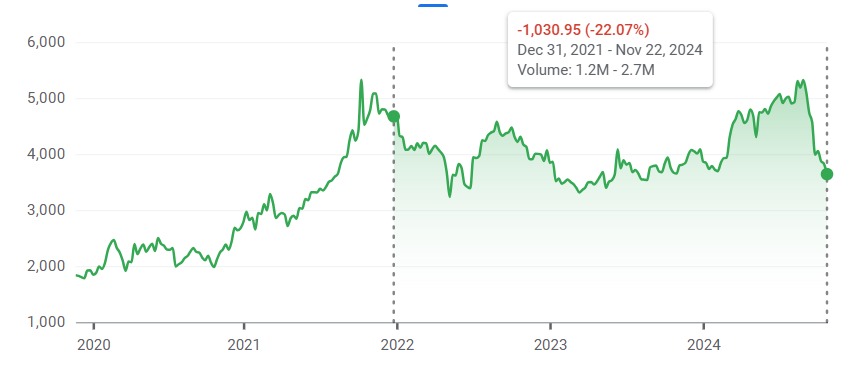
Avenue Supermart - CMP Rs 3,644
|
Avenue Supermart
|
2022
|
2023
|
2024
|
CAGR
|
|
Sales (Rs Cr)
|
30,976
|
42,840
|
50,789
|
28.05 per cent
|
|
EPS (Rs)
|
23.04
|
36.69
|
38.97
|
30.05 per cent
|
Avenue Supermart is growing its sales at a solid pace with a 28.05 per cent CAGR, slightly lower than its EPS growth of 30.05 per cent CAGR, indicating that the company is becoming more efficient at converting sales into profit, which is a positive sign of improving profitability and operational efficiency.

The -22 per cent return in the last three years, despite strong EPS growth, suggests that the stock may have been overvalued previously.
The high growth in both sales and EPS is a positive indicator, suggesting that the company is performing well and could continue to grow strongly. This growth justifies the relatively high P/E ratio of 88, especially when compared to the industry P/E of 53, indicating that the market may be pricing in the expectation of sustained strong performance.
The market cap to sales ratio of 4.3 is below the median ratio of 6.4, which suggests that, in terms of sales, the stock is priced more conservatively than it has been historically.
The stock is currently trading at Rs 3,644, just slightly above its intrinsic value of Rs 3,608, based on the median P/E ratio of 87. This small premium suggests that the stock is trading at fair value or could be considered slightly overvalued, given the current earnings and valuation.
DSIJ offers a service 'Flash News Investment' with recommendations for Profit-making Ideas for You (Weekly) based on research and analysis to help subscribers make healthy profits. If this interests you, then do download the service details pdf here