Rs 10,000 to Rs 10 crore: Nippon India Growth Fund wealth creation journey
Nippon India Growth Fund Performance Review
If you had invested Rs 10,000 per month through SIP in the Nippon India Growth Fund 25 years ago, that investment would have grown to over Rs 10 crore. The Nippon India Growth Fund reflects the growth of India's economic development after the liberalisation policy of India. From witnessing the most severe global economic and financial crises to achieving key economic milestones, the fund has seen all major macroeconomic events over the last 28 years.(see the table below).
DSIJ’s 'multibagger Pick’ service recommends well researched multibagger stocks with High Returns potential. If this interests you, do download the service details here.
|
Year
|
Event
|
|
1997
|
Asian financial crisis
|
|
2000
|
Capital market reforms
|
|
2001
|
9/11 attack in New York
|
|
2004
|
NAV crossed 100
|
|
2006
|
India's GDP crosses $1 Trillion, Sensex crosses 10K
|
|
2007-08
|
Global Financial Crisis
|
|
2014
|
India's GDP crosses $2 Trillion, Sensex crosses 20K
|
|
2010
|
NAV crossed 500
|
|
2017
|
NAV crossed 1000
|
|
2019
|
COVID - 19
|
|
2021
|
India's GDP crosses $3 Trillion, Sensex crosses 50K
|
|
2023
|
NAV crossed 3000
|
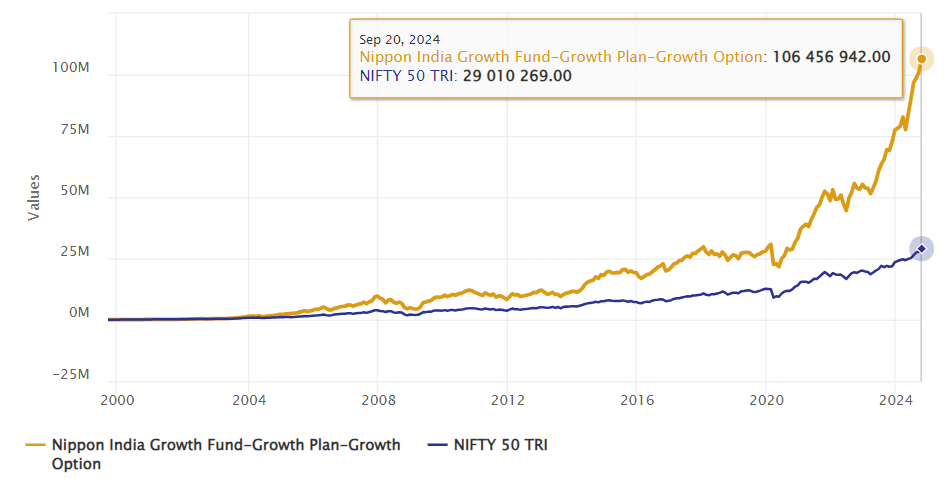
The chart below shows the growth of a Rs 10,000 SIP investment in Nippon India Growth Fund compared to the Nifty 50 TRI in the last 25 years. Nippon India Growth Fund outperformed with a huge margin, generating substantial alpha for investors.
Although the Nifty 50 TRI chart appears relatively flat, it's observed that the CAGR return for Nifty 50 TRI over this period was around 15 per cent. The flat appearance is due to the outstanding performance of Nippon India Growth Fund, which achieved a CAGR of 23 per cent.
With a cumulative investment of around Rs 30 lakh, you could have accumulated a corpus of nearly Rs 10 crore through SIP.

Source: Advisorkhoj.com
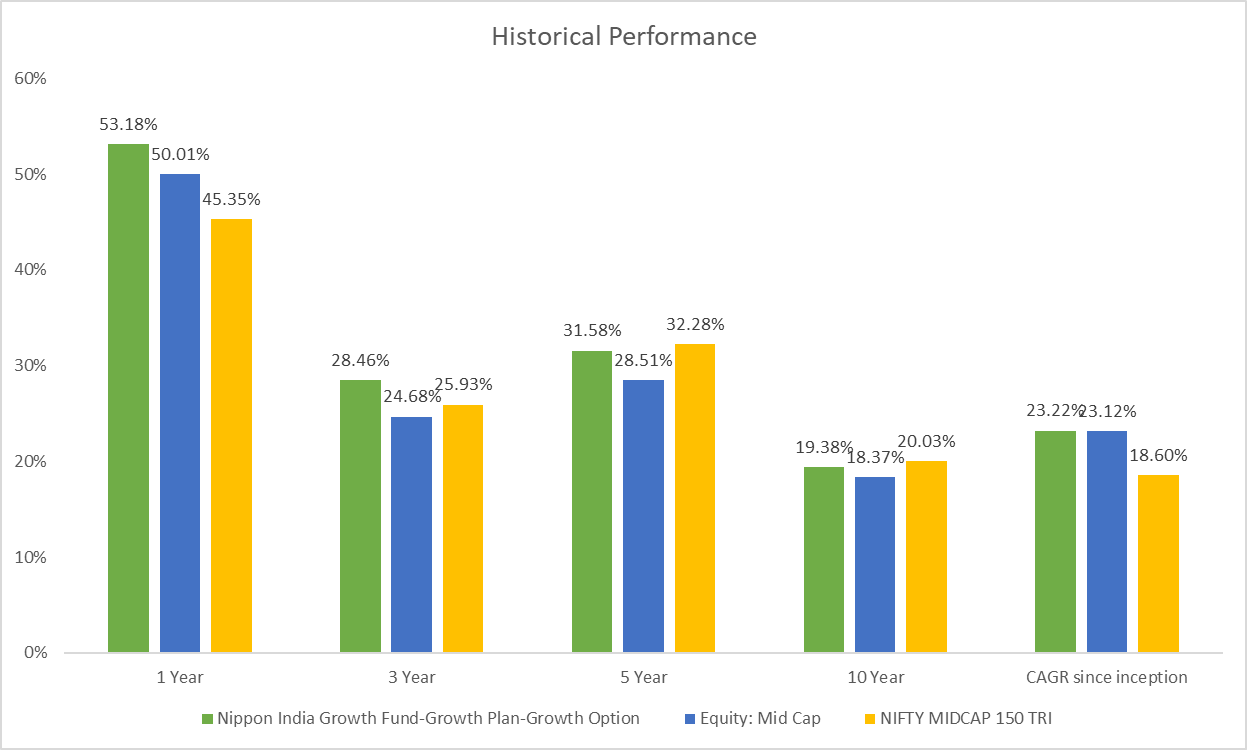
Historical Performance - Scheme Vs Category Vs Benchmark

Source: AMFI
Many vintage funds suffer swings, and the Nippon India Growth Fund is no different. For six out of the last seven years, the fund has consistently ranked in the top two quartiles. Consistent performance is a fundamental characteristic of leading mutual funds.
The Nippon India Growth Fund's continuous outperformance over its peers can be attributed to the fund manager's stock selection technique and Nippon India Mutual Fund's research strength.
The table below shows Nippon India Growth Fund's quartile rankings during the previous decade.
|
Total Return( per cent)
|
Nippon India Growth Fund
|
Category
|
NIFTY Midcap 150 TRI
|
Quartile Rank
|
|
2014
|
54.87
|
71.82
|
62.67
|
Bottom
|
|
2015
|
6.35
|
8.48
|
9.7
|
Bottom
|
|
2016
|
3.51
|
4.63
|
6.53
|
Lower Mid
|
|
2017
|
44.22
|
41.99
|
55.73
|
Upper Mid
|
|
2018
|
-10.9
|
-11.15
|
-12.62
|
Upper Mid
|
|
2019
|
6.78
|
3.12
|
0.62
|
Top
|
|
2020
|
22.05
|
24.09
|
25.56
|
Lower Mid
|
|
2021
|
46.46
|
44.18
|
48.16
|
Upper Mid
|
|
2022
|
5.81
|
2.43
|
3.91
|
Top
|
|
2023
|
48.61
|
37.04
|
44.61
|
Top
|
|
2024 YTD
|
9.49
|
11.94
|
29.21
|
Bottom
|
About Nippon India Growth Fund
The fund was launched in October 1995 and has over Rs 33,703 crores of assets under management (as of August 30, 2024). The expense ratio of the fund is 1.59 per cent. The fund primarily invests in midcap stocks (currently 66.37 per cent of the scheme holdings). Rupesh Patel and Sanjay Doshi are the fund managers of this scheme. Both fund managers have a strong long-term track record.
Nippon India Growth Fund's impressive long-term performance and consistent top-quartile rankings show its strong management and research. This makes it a leading choice for investors seeking substantial long-term growth.
Disclaimer: The article is for informational purposes only and not investment advice.